The Other 70%, Women’s Golf
International Growth Across Non-D1 Women’s College Golf
I coached women’s golf for a year at Stephen F. Austin. I came in with no prior women’s golf experience - I’d only been around men’s programs up to that point. In recruiting, it took me a while to calibrate, honestly. I remember being struck early on by how accurate they all were off the tee! It made it hard for me to evaluate ball-striking, at first.
I also tried recruiting internationally, reaching out to players ranked high on European golf rankings. One was Sara Kouskova - we had a couple of conversations, but she ended up at the University of Texas. Looking back, I was probably aiming a bit too high for where our program sat at the time.
However, I learned a lot that year about the dynamics of college golf recruiting on the women’s side. What’s interesting is how things have evolved with speed since then.
Last week I showed that D2 and NAIA men’s golf had grown their international representation dramatically over twenty years - D2 tripled from 9% to 27%, and NAIA went from 5% to 27%. D3 remained the most American division, held back by the no-scholarship barrier. The UK dominated men’s pipelines into D1 and D2, while Spain carved out a distinct NAIA niche.
Does the women’s side look the same?
I ran the same analysis on the women’s data. Same divisions, same 21-season window, same ~75,000 player dataset across roughly 1,030 programs and 157,000+ roster entries.
Women’s D1: More International Than the Men
Before getting into the non-D1 divisions, let’s recap the D1 baseline.
International players have grown from about 17% of D1 women’s rosters twenty years ago to 35% in 2025-26. That’s slightly higher than men’s D1, which sits at 33%.
The gap is small - two percentage points - but it’s been consistent for the past several years. Part of it is probably roster composition. Women’s D1 rosters tend to be smaller than men’s (fewer walk-ons, smaller roster sizes), so each international recruit shifts the percentage more. I think the LPGA Tour’s growing global diversity plays a role too - more so than on the PGA Tour side - and my best guess is that professional visibility feeds into junior development programs that eventually send players to college.
When I show you the non-D1 women’s numbers, keep in mind that at the D1 level, men’s and women’s golf are about equally international.
The Non-D1 Picture
Here’s the 20-year trend for international players as a share of all women’s roster spots.
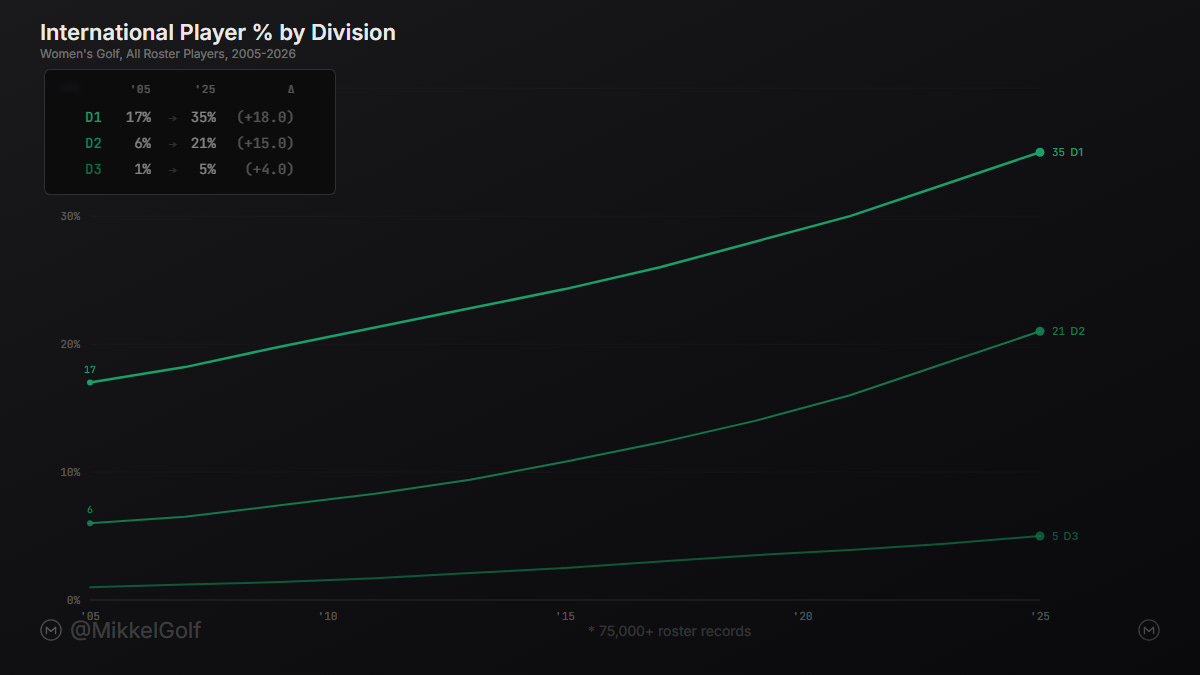
D1: 17% (2005) → 35% (2025)
D2: 6% (2005) → 21% (2025)
D3: 1% (2005) → 5% (2025)
NAIA: volatile/unreliable data coverage
NJCAA I: ~26% in 2025, small sample
D2 women’s has climbed from 6% to 21% international over twenty years. That trajectory is similar to D2 men’s (27%), though the women’s number sits a few points lower. Nearly one in five D2 women’s golfers is now international.
D3 women’s is at 5% international - lower than D3 men’s (8%). The no-scholarship barrier that makes D3 the most American division in men’s golf hits even harder on the women’s side.
NAIA women’s data needs a caveat. The school count in my dataset swings wildly year to year - from 5 programs to 93 to 16 - because NAIA schools are inconsistent about posting rosters publicly. When the sample swings that much, you’re measuring scraping coverage, not a real trend. I’m setting NAIA women’s aside and focusing on D2, D3, and NJCAA I where the data is more consistent.
The Freshmen Pipeline
Total roster percentages are a lagging indicator. The freshmen classes show where recruiting is heading.
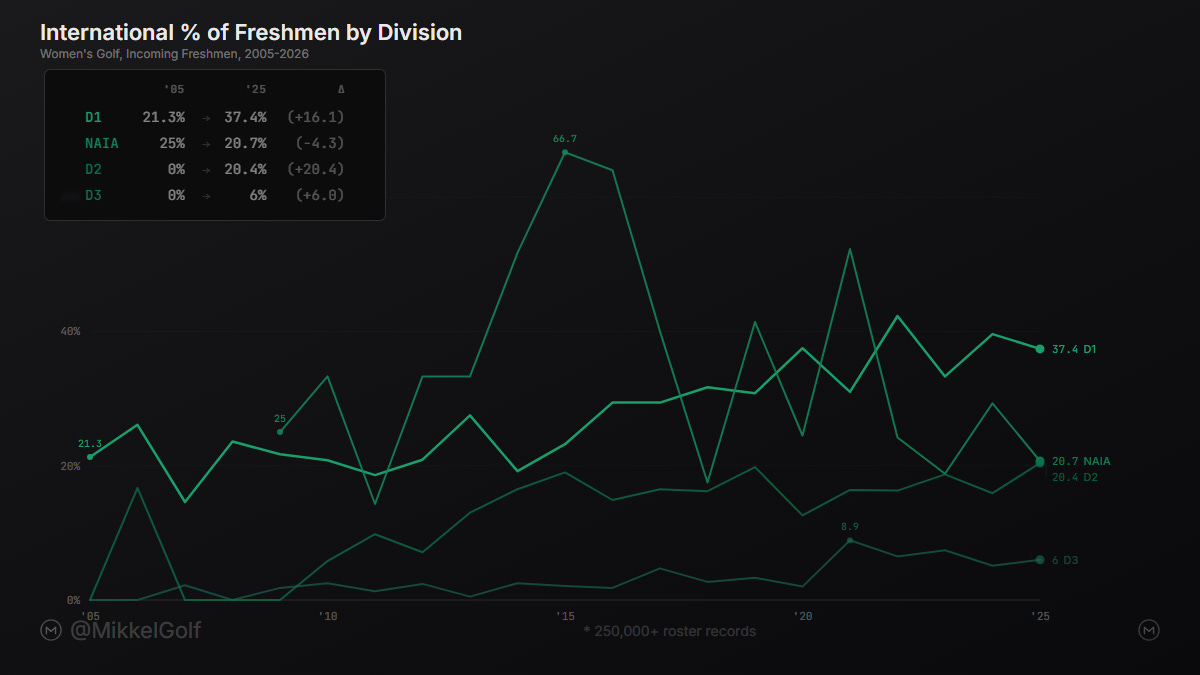
D1 freshmen: 37%
D2 freshmen: 20%
D3 freshmen: 6%
NAIA freshmen: 21%
NJCAA I freshmen: 27% (small sample, 30 total)
These freshmen numbers run a few points behind the men’s equivalents in D2 and D3 (men’s D2 freshmen are at 24%, men’s D3 at 8%). The international wave in women’s college golf is real at every level, but it’s hitting the non-D1 women’s divisions slightly later than the men’s side - except at D1, where women are ahead.
Non-D1 women’s divisions slightly later than the men’s side - except at D1, where women are ahead.
Where Are the Players Coming From?
This is where the women’s data gets genuinely different from the men’s.
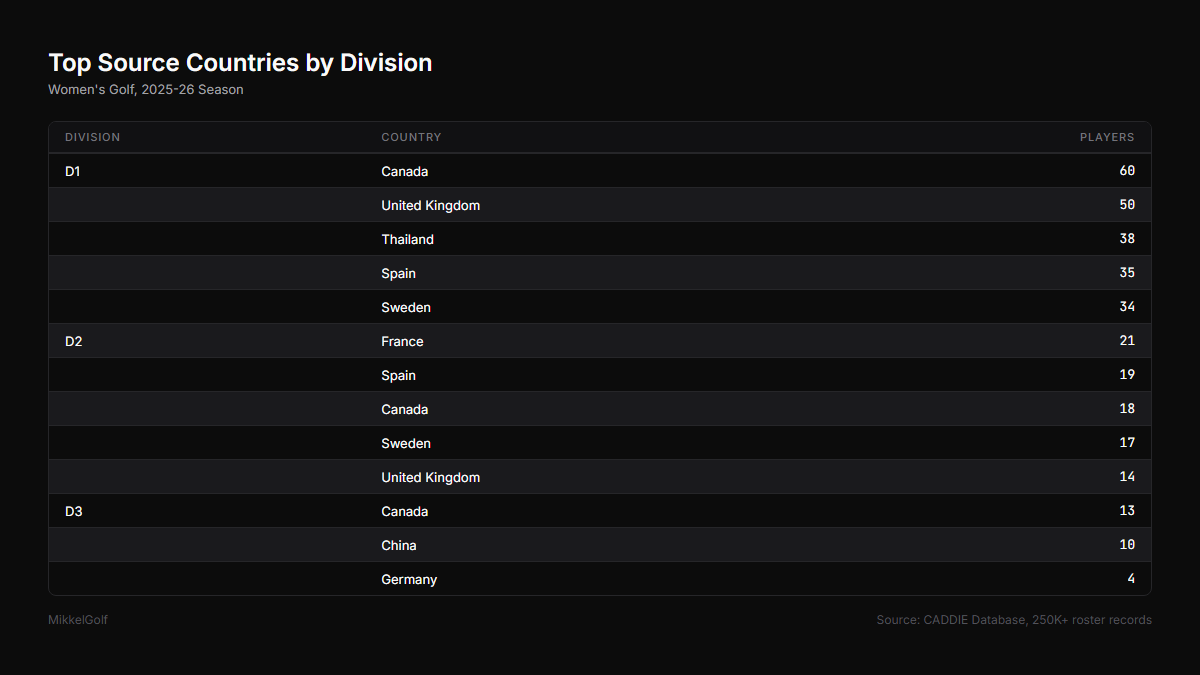
In D1, the top five are Canada (60), UK (50), Thailand (38), Spain (35), and Sweden (34).
Thailand stands out. It has 38 players in D1 women’s golf, making it the third-largest source country. On the men’s side, Thailand barely registers outside the top ten. Thailand has a deep women’s golf culture driven by a string of elite LPGA Tour players over the past decade - Ariya and Moriya Jutanugarn, Patty Tavatanakit, Atthaya Thitikul. The professional visibility has probably fueled junior development programs that now feed directly into U.S. college golf, to a large degree on the women’s side.
Thailand also shows up in D3 (3 players) and NAIA (4 players). It’s one of the most gender-asymmetric pipelines in college golf.
The other D1 difference from the men’s side: Canada leads the women’s top five (60 players), whereas the UK leads the men’s. The gap between Canada and the UK is much narrower in women’s golf than in men’s.
D2 Women’s: France Leads
In our dataset, France leads D2 women’s with 21 players.
I don’t have a definitive explanation as to why France. My best guess is specific recruiting networks connecting French women’s junior golf to D2 programs. A D2 coach recruits a couple of players, they have a good experience, word gets back to their home clubs, and the next cohort follows the same path. These pipelines tend to be relationship-driven and self-reinforcing. Players recruit more players.
D3 Women’s: The Most American Division, by Far
D3 women’s golf is 95% American. Only 5% international, compared to 8% on the men’s D3 side.
The source countries are sparse: Canada (13), China (10), Germany (4). That’s about it.
The no-scholarship explanation applies to both genders, but I think it hits harder for women internationally. The pool of international women golfers seriously considering U.S. college golf is smaller than the men’s pool to begin with. University back home is often free or very cheap - at least fro Europeans. D1 and D2 can offer athletic aid - D3 can’t. So the international women who do come to the U.S. concentrate even more heavily in the scholarship-offering divisions than men do, if you ask me.
The men’s D3 number is a bit higher (8%) partly because of academically-driven enrollment - players from China and India who choose a D3 school for educational reasons and then join the golf team. That pattern exists for women too (China has 10 players in D3 women’s), but at a smaller scale.
NJCAA I: Small but Worth Noting
NJCAA Division I women’s golf is a tiny sample in our dataset - roughly 23 schools and about 58 players with country data in 2025-26. The international percentage runs around 27%. The only source country with enough players to register is the UK (4). With a sample this small, two or three players from one country at one school shift the entire division’s numbers. I need to work on the data quality of my scrapers in this division.
Where This Leaves Us
What I keep wondering is whether the women’s non-D1 pipelines will follow the same trajectory the men’s side took - a slow build through individual coaching connections, then a tipping point where it becomes self-sustaining - or whether they’ll develop differently. France leading women’s D2 while the UK leads men’s D2 suggests these pipelines have their own logic.
---
You can explore the full data in the interactive dashboards I’ve built:
If you found this useful, please subscribe to this newsletter and share with friends. More data-driven college golf analysis coming soon.
Previous posts in this series:
Mikkel Bjerch-Andresen
Golf coach, data analyst, writer