International Growth Across Non-D1 Men’s College Golf
The Other 70% - Roster Data Deep Dive
D1 gets all the attention - the Golf Channel coverage, the rankings debates, the transfer portal drama. Even in the roster deep dives on this Substack, it’s been all about D1. But D1 represents roughly 30% of men’s college golf programs in the United States. The other 70% play in Division II, Division III, NAIA, and NJCAA. And those divisions have been going through their own demographic shifts - some of them more dramatic than what we’ve seen at the top level.
In the earlier pieces, I showed that international players have been steadily growing as a share of D1 men’s golf rosters. That was D1. I wanted to know whether the same forces were reshaping the rest of college golf - or whether these divisions were following entirely different patterns.
So I expanded the dataset. The analysis covers ~75,000 unique players across roughly 1,030 programs, drawing on over 157,000 roster entries spanning 21 seasons from 2005-06 through 2025-26. (A quick note: since the D1 pieces published last fall and in January, the dataset has been expanded with additional scraping and cleaned further, which shifts some percentages by a few points. The trends and overall conclusions hold.)
A Quick Map of the Divisions
For readers who know D1 recruiting but haven’t followed the other divisions:
Division II is the middle tier of NCAA athletics. Schools offer partial athletic scholarships - not as many as D1, but they exist. There are about 193 D2 men’s golf programs in the dataset.
Division III is the NCAA’s largest division by number of schools, but it does not offer athletic scholarships. Players attend for academics, fit, or location - and play competitive golf on the side (mostly). Financial aid exists, but it’s need-based or academic, not athletic.
NAIA (National Association of Intercollegiate Athletics) is a separate governing body from the NCAA. NAIA schools tend to be smaller, and they do offer athletic scholarships. Think of it as an alternative pipeline running parallel to the NCAA system.
NJCAA (National Junior College Athletic Association) covers two-year programs - junior colleges. Players spend a year or two, then transfer to four-year schools. NJCAA Division I programs can offer full athletic scholarships.
Each of these divisions has its own scholarship structures and - as it turns out - its own international recruiting dynamics.
The International Wave, Division by Division
Here’s the 20-year trend for international players as a share of all men’s roster spots, across the divisions.
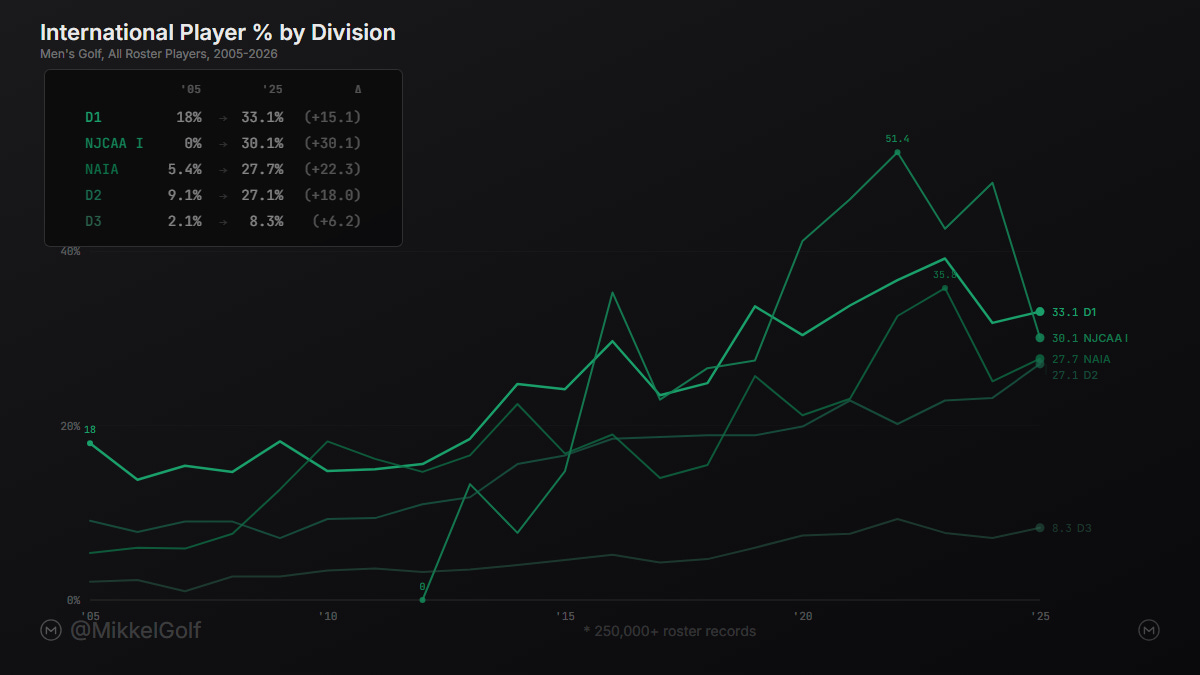
D1 has climbed from roughly 18% to 33% international over the past two decades. But D2 has been on a similar trajectory - from 9% up to 27%. NAIA has grown even faster, from 5% to 27%. These two divisions have roughly tripled their international representation in twenty years.
D3 is the outlier. It sits at 8%. I’ll come back to why.
NJCAA Division I sits at about 30% international in 2025-26, but the sample is small - roughly 34 schools and 124 players with country data. The trend is real, but year-to-year volatility makes it hard to read with confidence.
Freshmen
Total roster percentages reflect years of accumulated recruiting decisions. The freshmen classes tell you where things are heading now.
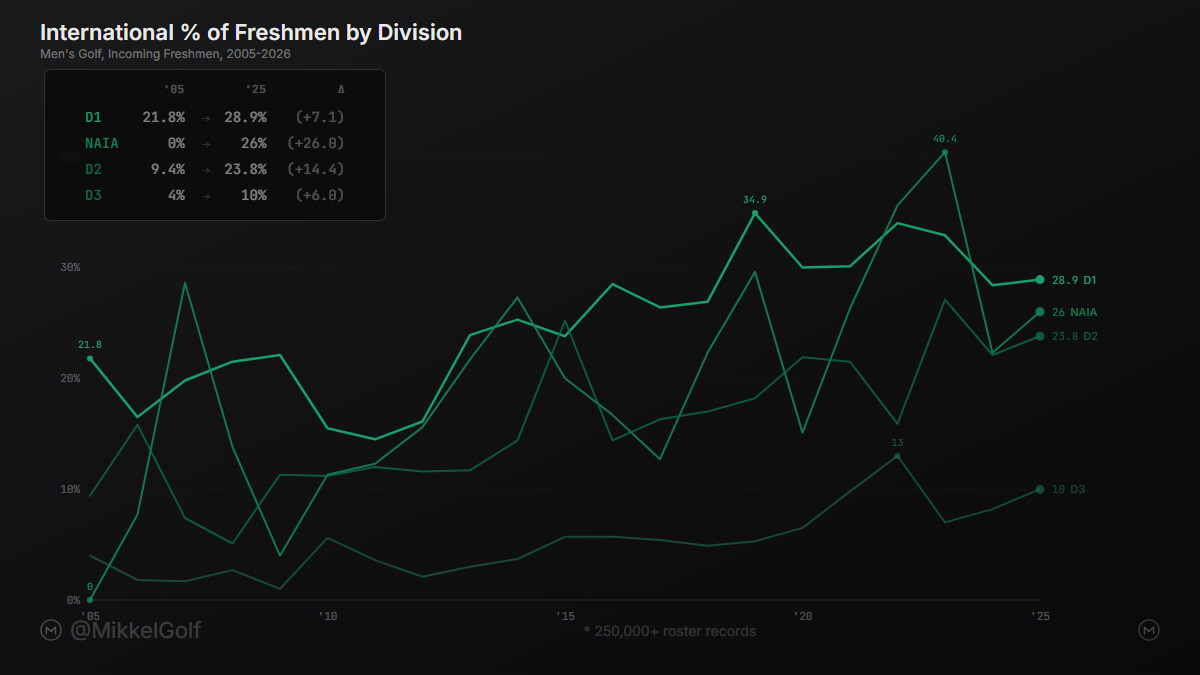
D2 freshmen classes have reached 24% international - one in four incoming D2 freshmen is now from outside the United States. NAIA freshmen are at 26%. Both are within a few points of D1 freshmen (29%). That gap is smaller than I expected.
D3 freshmen sit at 8%, and even that is a shift from near-zero twenty years ago. D3 has been the most structurally resistant to international growth for reasons I’ll get into, so any movement there is worth noting.
Who Is Going Where?

The international growth isn’t coming from the same countries across all divisions. Each level has its own recruitment networks, and the country breakdowns reveal distinct pipelines.
D1: UK (98), Canada (70), Sweden (57), Spain (34), France (30)
D2: UK (106), Canada (68), Sweden (45), Spain (37), Mexico (27)
D3: Canada (43), Sweden (17), Spain (12), China (11), India (10)
NAIA: Spain (29), UK (25), Canada (19), South Africa (14), France (14)
NJCAA I: UK (15), Australia (4)
In D1, the UK leads with 98 players, followed by Canada (70) and Sweden (57). That UK-to-D1 pipeline is well-established, driven by agencies and a steady flow of players from English and Scottish junior golf.
D2 follows a similar pattern. The UK actually has more D2 men’s golfers (106) than D1 (98) - something I didn’t expect. Canada (68) and Sweden (45) fill out the top three. The cast of countries is recognizable from D1, just distributed a bit differently.
D3 is where the pattern shifts. Canada leads with 43 players. That makes sense - proximity and familiarity with small liberal arts colleges. But then you see China (11) and India (10) in the top five. D3 schools don’t offer athletic scholarships, so these are more likely students who chose a school for academic reasons and then joined the golf team. A different pipeline entirely.
NAIA is its own story. Spain leads with 29 players, ahead of the UK (25) and Canada (19). That Spanish pipeline into NAIA is distinctive. I don’t know of NAIA coaches traveling internationally to recruit - the budgets are likely too small. More likely, a Spanish player ended up at a program through an agency or internet connection, had a good experience, and word spread back home. Once one of these channels opens, it self-reinforces.
NJCAA Division I, with its small sample, is UK-heavy (15 players). Some of these may be D1-caliber recruits who were academic non-qualifiers - they go to junior college after being recruited by D1 schools, get their academics sorted, and transfer up. It’s a pathway, not a destination.
The D3 Story: The Most American Division
D3 deserves its own section because it’s structurally different from everything else.
At 8% international, D3 is the most American division in men’s college golf. The reason is straightforward: no athletic scholarships. The financial incentive that pulls a Swedish junior golfer to a D2 school in South Carolina or an NAIA program in Oklahoma doesn’t exist in D3. If you’re an international player at a D3 school, you’re paying full tuition (or close to it), probably at a small liberal arts college, and you’re playing golf without the financial support that other divisions can offer.
For most international families, the cost of attending a U.S. college only makes sense if there’s a scholarship offsetting it. D3 removes that from the equation.
But even with that structural barrier, D3 freshmen are now at 8% international - the same as the overall roster share, which means the trend has stabilized rather than still accelerating. Twenty years ago it was near-zero. Something is shifting - maybe more international families are considering U.S. liberal arts education independent of athletics, maybe the overall pool of junior golfers looking at U.S. college golf has grown large enough that some end up at D3 programs by choice. I don’t have a clean answer for why, but the trend is real.
Stepping Back - Thoughts on Men’s Golf
When I started the D1 analysis last year, I framed it as a story about the growing share of international golfers in Division I.
D1 isn’t alone. D2 and NAIA have experienced international growth that’s proportionally just as large. Twenty years ago, D2 was 8% international and NAIA was 4%. Now D2 is at 26% and NAIA at 33%. If you’re a U.S. high school golfer who doesn’t quite have the resume for D1 and is looking at D2 or NAIA, the competitive picture has changed there too.
The pipelines are different by division. UK players flow primarily to D1 and D2. Spanish players have built a strong presence in NAIA. Canadian players show up everywhere, including D3. Chinese and Indian players concentrate at D3, driven by academics rather than athletics. These reflect specific recruiting relationships, agency networks, and word-of-mouth channels that developed over time.
I coached at three D1 programs over seven years. I evaluated international talent and watched the balance shift in real time. But I didn’t think much about what was happening in D2, D3, or NAIA during those years. The other 70% is shifting too.
---
Next week: the women’s side of this story.
You can explore the full data in the interactive dashboards I’ve built:
If you found this useful, please subscribe to this newsletter and share with friends. More data-driven college golf analysis coming soon.
Previous posts in this series:
Mikkel Bjerch-Andresen
Golf coach, data analyst, writer