A Deep Dive into Norway's Top Junior Golf Tour – Insights from Srixon Tour 2025
How Bogey Avoidance Drives Elite Performance on Norway's Srixon Tour
If you’ve been following along here, you know I’m all about digging into the numbers to make sense of this game we love. I’m very fortunate as I get to be around soma spiring junior golfers here in Norway from time to time.
In an effort to help some of them, I pulled together a hefty dataset from this year’s Srixon Tour (the Norwegian Junior Tour) action: nearly 2,500 rounds, 262 players, and over 44,000 hole scores. The data revealed some eye-opening trends on what separates the standouts.
For the full deep dive in Norwegian, head over to my Norsk Golf piece.
Here on Substack, I’ll break down the core ideas from the article in English, pulling in the same tables and graphs where it makes sense.
The Big Picture: Scoring Trends and Standout Rounds
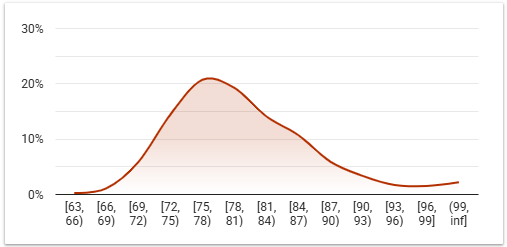
Average score across the tour hit 79.94 this year, with some differences between the divisions:
Boys U19: 77.61
Girls U19: 82.22
Boys U15: 82.29
Girls U15: 84.64
The distribution curve (see graph below, like the one in the Norsk Golf piece) peaks at 75-77, with one in five cards landing there overall, and one in four for Boys U19.
Round 1 Edges: Prep Pays, But Is It All Mental?
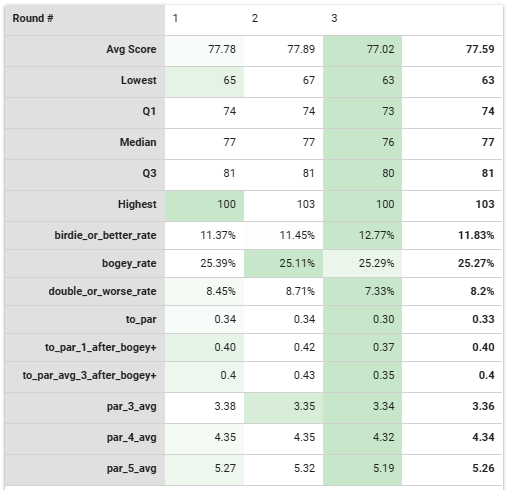
As we’ve seen numerous times here before, scoring typically gets better the further into a junior- or college golf tournament we get. The Srixon Tour in 2025 was no exception. In Boys U19 (skipping Junior NM for its cut effect), Round 3 averages were almost a stroke lower than previous rounds. Virtually all scoring parameters showed progression from round 1 through 3:
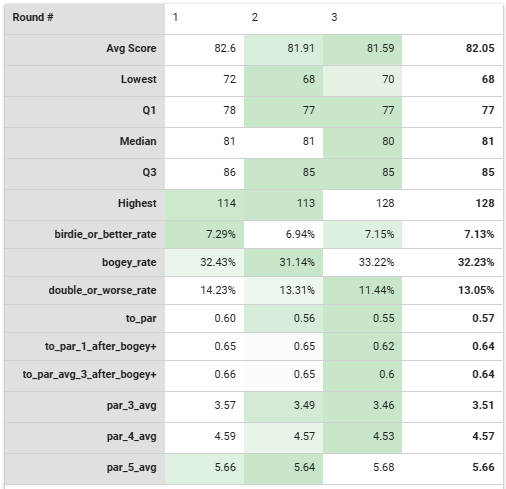
Girls U19 followed suit, with fewer doubles-or-worse driving the drop in scoring average through the tournaments. Here is the Girls U19 table:
The Bogey Hangover: 26% Dip and Lingering Costs
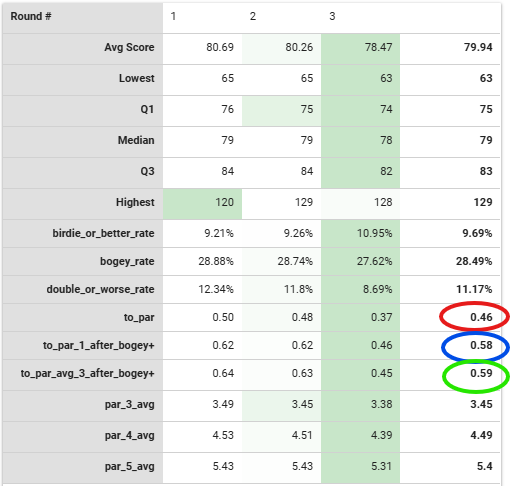
Across all holes, Srixon players’ baseline for the season was +0.46 to par. What about the hole following a bogey or worse? Jumps to +0.58 – a 26% hit. The cost lingers too - the next three holes after a bogey or worse average +0.59, accumulating the cost to almost half a stroke to baseline.
Norwegian juniors bleed here, likely from hesitation/decision making/over- or under-correction from the signal of making a bogey or worse. You can filter for your own via the dashboard on my website.
Rankings and Top-10 Separation
When we drill down on the Boys U19 division (which has the most rows of data), let’s look at the top-10 players vs. the players outside the top-10.
*Top-10 defined as strokes gained to field per hole played*
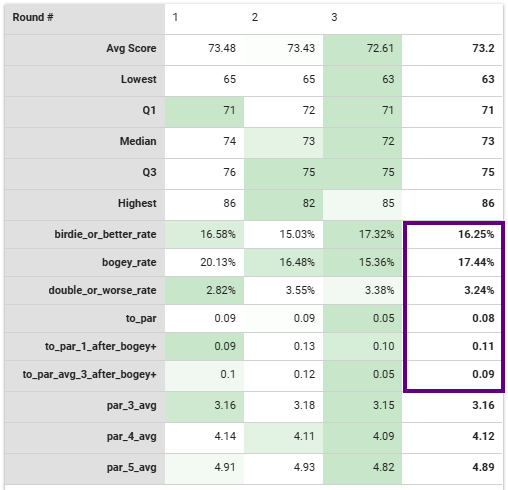
We can see the scoring difference is roughly 5 strokes per round. The really interesting part? The birdie gap is just 5% – less than one per round. 80% of the scoring difference between these two groups comes from bogey-or-worse avoidance.
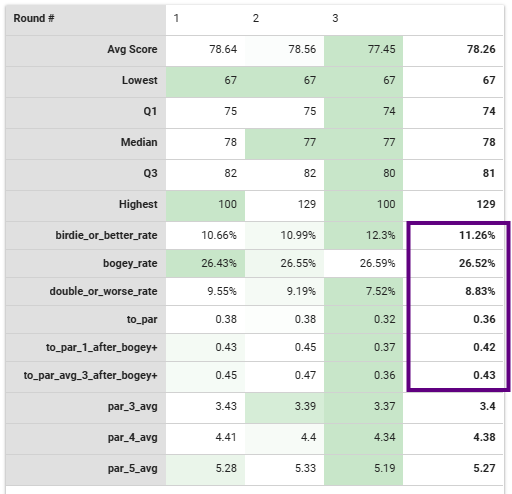
We see the tournament progression for both groups. Virtually every scoring parameter gets better with each round. Further, there’s a post-bogey cost for both groups. Top-10 players perform 37% worse on the hole following a bogey or worse compared to their baseline (0.11 to par vs 0.08 to par). The outside top-10 group performs 16% worse (0.42 to par vs 0.36 to par). Some of the difference here is driven by the lower baseline for the top-10 players.
The standouts seem to steady the ship better over the next three as they average 0.09 to par compared to their 0.08 baseline, whereas the outside top-10 group roughly maintains the post-bogey cost across the next three holes (0.43 to par).
Tough Holes Amplify the Gap
This graph is from the 2024 data from the same tour (Srixon 2024).
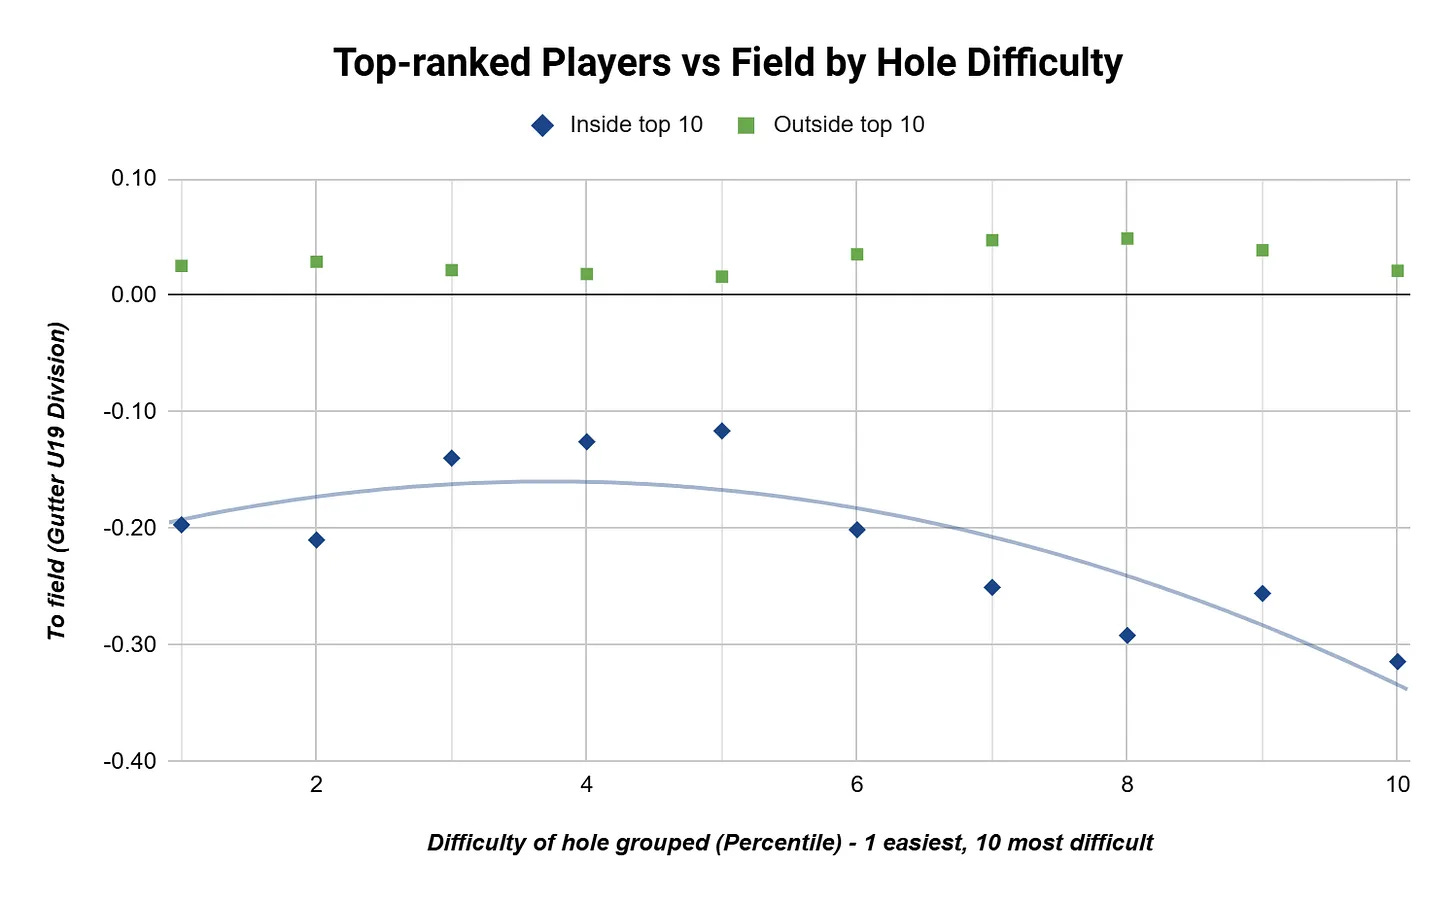
The toughest holes (in terms of field average to par) separate the two groups the most. The middle-of-the-road holes separate the least, mainly driven by lower rates of bogeys or worse by the field - making it harder for top players to separate by making par.
However, interestingly, we see a up-tick in strokes gained for the top players on the easiest holes. There are typically reachable par 5s. They often require similar shots to the hardest holes to par: a solid drive in play, avoiding trouble, and a longer club to the green.
Thank you Norsk Golf for publishing the article!
For Norwegian readers, grab the full Norsk Golf article. Dive deeper on my dashboard or here for more junior/college/pro breakdowns.
Subscribe for free for future posts:
Mikkel Bjerch-Andresen
Golf coach, data analyst, writer